Reconciliation58 / 100
Moderate reconciliation pressure. Cross-cultural complexity is real and should shape ministry posture.
Most churches make neighborhood decisions — where to plant, where to invest, where to stay — without anything to watch. The result is a planter sent somewhere that was never going to work, years spent reading a neighborhood wrong, and no way to explain why. GospelGraph gives you the instrument panel: tract-level Gospel impact data, measured over time, explained in language a pastor can act on.
The average church plant costs $180,000 and four years of a planter's life. Most of them chose the neighborhood the same way they chose a restaurant.
The breakthrough
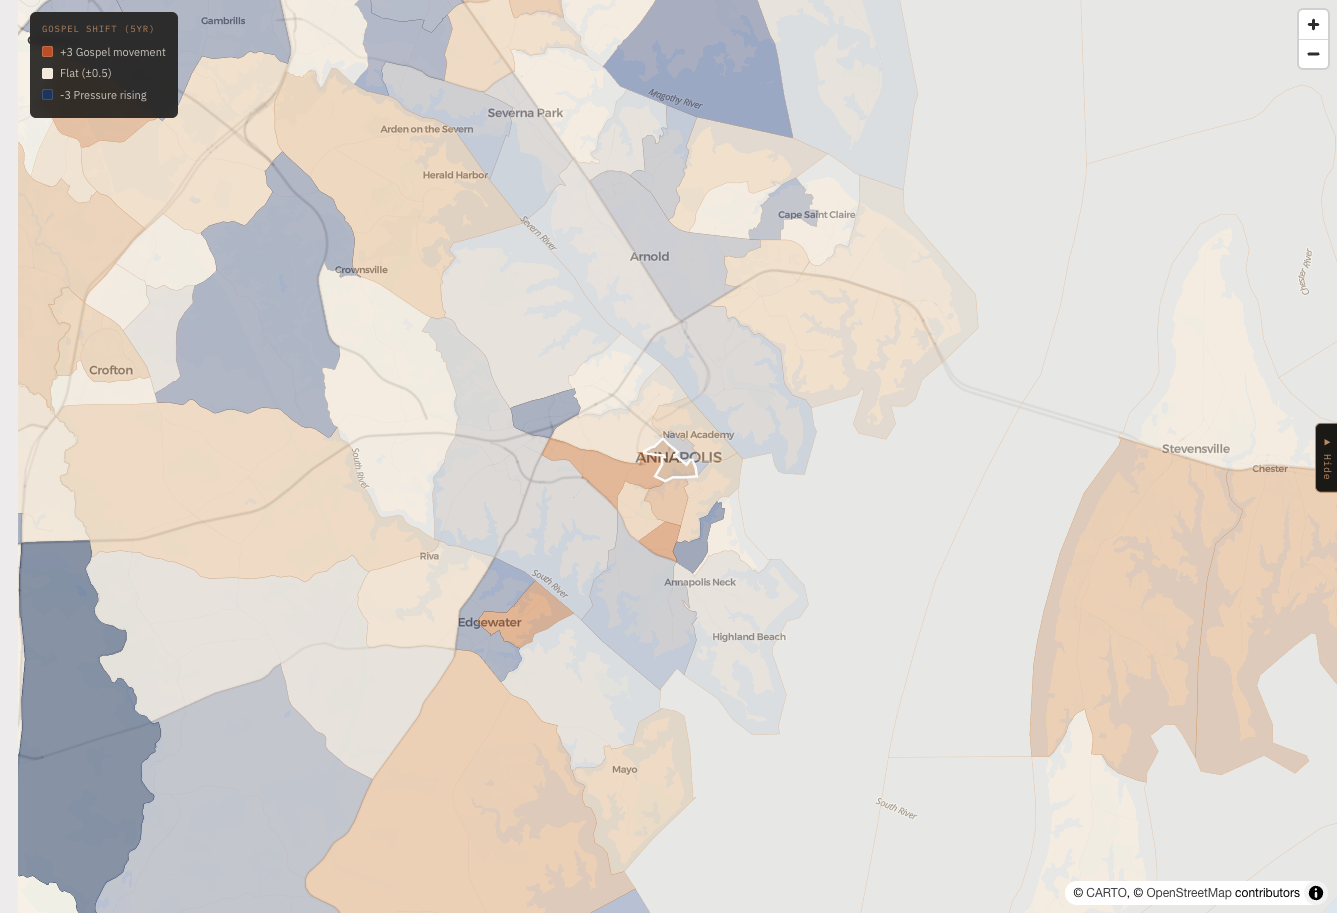
That is the real product claim. Not generic church analytics. Not another neighborhood profile. GospelGraph tracks directional movement at the tract level so ministry leaders can see whether a place is hardening, softening, compounding, or stalling.
And it does not stop at raw scores. The system explains what the movement means in pastoral terms — the kind of language a planter, session, or elder team can actually act on without needing to think like data analysts.
The result is not omniscience. It is disciplined visibility: a way to compare places, watch change across years, and make field decisions with something stronger than anecdote.
One address. One tract. The wound, the people, the call — in five sections.
Field report walkthrough
Scroll through the report
The GospelGraph Explorer
Census Tract 7027.02
Gospel Shift (5yr) · open field report
What changes when you can actually see the ground.
Not a dashboard for dashboard people. A field instrument for pastors, planters, and ministry leaders who need neighborhood clarity before they move bodies, dollars, and years.
Browse the full U.S. map with Need Pressure, Gospel Shift, and Gospel Desert overlays before you commit a dollar, a planter, or a partnership to a neighborhood you've only driven through.
Don't settle for a single score. Inspect all five Gospel Impact domains for any tract — so you know whether you're looking at a reconciliation problem, a family stability problem, or an economic abandonment problem before you design ministry.
Type an address — a building your church owns, a neighborhood you're considering, a city your denomination is watching — and land instantly in the tract with full ministry context already loaded.
Compare today's tract conditions against the 2020 baseline. Know whether a neighborhood is hardening, softening, or stalling — before you plant into it or pull out of it.
Generate pastoral field reports with domain breakdowns, trend interpretations, and neighborhood context — the kind of output you can put in front of a session or a missions committee without translating anything.
Plant, reallocate, stay, or go — with neighborhood intelligence behind the decision instead of the loudest voice in the room.
Live preview · U.S. map
Start with one address
Start with a free field report on a real tract. When you need unlimited reports, tract comparison, and nationwide visibility, move into the Explorer with the ground already in view.
Institutional access
GospelGraph is used by church planting leaders in the PCA to make site selection decisions at scale. Institutional access includes full nationwide explorer access for your planting team, field report generation across your entire portfolio, and a direct line to the data behind every score.
If you are responsible for where planters go, this was built for you.
I did not build this tool because I saw a market gap. I built the tool I wish I had before three years of incarnational mercy ministry in public housing.
Why trust this
GospelGraph sits at the convergence of engineering, journalism, and theology. It was built by someone who has written production software, reported for a living, and spent years learning to read neighborhoods without romanticism.
This is not abstract analytics theater. It is pastoral production software — built to help planters, pastors, and ministry leaders see the ground with enough clarity to act before momentum is lost or pressure is misread.
I did not hire someone to build this. I built it. That matters more than the methodology.
Read the methodology →